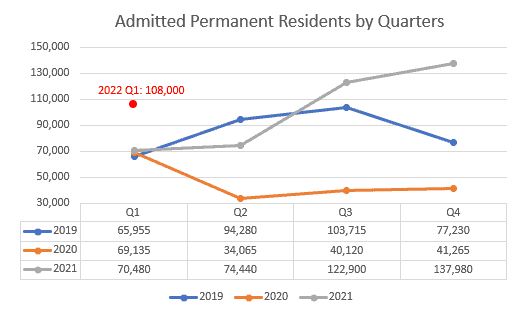
On March 31, the Minister of Immigration, Refugees and Citizenship, Sean Fraser, announced that IRCC surpassed its goal to make 147,000 permanent residence final decisions in the first quarter of 2022—doubling the number of final decisions in the same period in 2021.
Through these efforts, Canada has welcomed over 108,000 new permanent residents so far this year. In addition, Canada has exceeded its citizenship goals for 2021–2022, with over 210,000 new Canadian citizens.
Why Choose Our Immigration Legal Services?
Taylor Janis LLP Pamphlet for immigration services
Modernizing and Improving Immigration Services in Canada
IRCC is modernizing and improving its service for immigrant candidates and permanent residents by
- Offering online testing
- Holding virtual citizenship ceremonies
- Creating online application tracker
- Moving more applications from paper to online
- Hiring new processing staff
- Digitizing applications
- Reallocating work among IRCC offices around the world; and
- Updating online processing times tool
In the first quarter of 2022, IRCC approved the most permanent residents over the same period of past years. The figure below shows the number of admitted permanent residents by quarter from quarter 1 of 2019 to quarter 1 of 2022.

The new announcement indicates that in 2022, Canada will welcome the most immigrants in history. The IRCC 2021 annual report gives the 2022–2024 Immigration Levels Plan as below:
2022 2023 2024 | ||||||
| Projected admissions – Targets | 431,645 | 447,055 | 451,000 | |||
| Projected admissions – Ranges | Low | High | Low | High | Low | High |
| Economic immigration | 210,000 | 248,000 | 222,000 | 259,000 | 235,000 | 273,000 |
| Family reunification | 90,000 | 109,000 | 94,000 | 113,000 | 99,000 | 117,000 |
| Refugees, protected persons, humanitarian and compassionate and other | 60,000 | 88,000 | 64,000 | 93,000 | 56,000 | 85,000 |
| TOTAL | 360,000 | 445,000 | 380,000 | 465,000 | 390,000 | 475,000 |
Compared to the PR admission target of 401,000 for 2021, IRCC increased its target numbers by around 7.6%.
With the increased processing capacity, high target, as well as the fading influence of Covid-19, we will see the most immigrants in history coming to Canada in 2022.
Table 2 provides the numbers of Admitted Permanent Residents in 2021 by Destination and Immigration Category. We can see that nearly half of Permanent Residents chose Ontario as their residing destination, and over 60% of immigrants received their permanent status through economic programs. Family members of Canadian permanent residents and citizens occupy only 20% of people who become permanent residents in 2022.
Contact an Immigration Specialist in Vancouver Today
Should you have any questions or need advice on immigration applications, please do not hesitate to contact Taylor Janis or reach out to us directly online to book a consultation.
Permanent Residents Admitted in Canada for 2021
Table 2: Permanent Residents Admitted in 2021 by Destination and Immigration Category*
| Category / Destination | NL | PEI | NS | NB | QC | ON | MB | AK | AB | BC | YU | NT | NU | Not Stated | Sub-Total | ||
| Federal Economic – Skilled | 295 | 490 | 1,720 | 680 | 92,950 | 1,330 | 1,285 | 9,565 | 31,165 | 90 | 55 | 0 | 0 | 139,625 | |||
| Canadian Experience | 285 | 485 | 1,670 | 665 | 0 | 86,860 | 1,185 | 1,195 | 8,560 | 29,520 | 85 | 55 | 0 | 0 | 130,565 | ||
| Economic Public Policy | 0 | 5 | 0 | 0 | 105 | 0 | 0 | 30 | 75 | 0 | 0 | 0 | 0 | 215 | |||
| Skilled Trade | 0 | 0 | 0 | 0 | 135 | 0 | 5 | 40 | 335 | 0 | 0 | 0 | 0 | 515 | |||
| Skilled Worker | 10 | 0 | 50 | 15 | 5,850 | 145 | 85 | 935 | 1,235 | 5 | 0 | 0 | 0 | 8,330 | |||
| Atlantic Immigration Programs (AIP) | 410 | 265 | 2,670 | 1,580 | 0 | 0 | 0 | 0 | 0 | 0 | 0 | 0 | 0 | 0 | 4,925 | ||
| Rural and Northern Immigration (RNIP) | 0 | 350 | 50 | 0 | 0 | 125 | 0 | 0 | 0 | 0 | 525 | ||||||
| Federal Economic – Caregiver | 0 | 0 | 0 | 0 | 1,445 | 15 | 30 | 470 | 705 | 0 | 5 | 0 | 0 | 2,670 | |||
| Quebec Skilled Workers | 25,160 | 0 | 0 | 25,160 | |||||||||||||
| Federal Economic – Business | 0 | 5 | 10 | 10 | 0 | 230 | 20 | 0 | 35 | 250 | 0 | 0 | 0 | 0 | 560 | ||
| Self-Employed | — | — | 5 | — | 0 | 105 | 0 | — | 15 | 50 | — | 0 | 0 | 0 | 175 | ||
| Start-up Business | — | — | 5 | 10 | — | 125 | 20 | — | 25 | 200 | — | 0 | 0 | 0 | 385 | ||
| Quebec Business Immigrants | 1,685 | 0 | 0 | 1,685 | |||||||||||||
| Provincial Nominee Program | 510 | 1,480 | 2,275 | 1,815 | 0 | 11,025 | 10,320 | 6,505 | 8,585 | 11,000 | 365 | 120 | 0 | 0 | 54,000 | ||
| Temporary Resident to Permanent Resident Pathway | 105 | 160 | 920 | 415 | 0 | 12,935 | 1,080 | 415 | 1,695 | 6,085 | 50 | 25 | 0 | 0 | 23,885 | ||
| Economic – Total | 1,320 | 2,405 | 7,600 | 4,495 | 26,845 | 118,935 | 12,820 | 8,235 | 20,350 | 49,335 | 510 | 210 | 0 | 0 | 253,060 | ||
| Sponsored Children | 15 | 10 | 55 | 40 | 920 | 2,135 | 130 | 85 | 950 | 490 | 5 | — | 0 | 0 | 4,835 | ||
| Sponsored Extended Family Member | 0 | 0 | 0 | — | 70 | 135 | 5 | 5 | 140 | 45 | — | — | 0 | 0 | 400 | ||
| Sponsored Parent or Grandparent | 15 | 0 | 40 | 15 | 1,750 | 5,425 | 400 | 390 | 1,800 | 1,870 | 5 | — | 0 | 0 | 11,710 | ||
| Sponsored Spouse or Partner | 150 | 120 | 635 | 360 | 11,130 | 28,915 | 1,805 | 1,175 | 8,035 | 11,875 | 60 | 65 | 0 | 0 | 64,325 | ||
| Sponsored Family | 180 | 130 | 730 | 415 | 13,870 | 36,610 | 2,335 | 1,655 | 10,925 | 14,285 | 75 | 75 | 0 | 0 | 81,285 | ||
| Sponsored Family – Total | 180 | 130 | 730 | 415 | 13,870 | 36,610 | 2,335 | 1,655 | 10,925 | 14,285 | 75 | 75 | 0 | 0 | 81,285 | ||
| Blended Sponsorship Refugee | 0 | 0 | 10 | 0 | 0 | 40 | 10 | 0 | — | 15 | 0 | 0 | 0 | 0 | 75 | ||
| Government-Assisted Refugee | 460 | 70 | 395 | 300 | 975 | 3,860 | 395 | 690 | 2,155 | 1,110 | 0 | 0 | 10,410 | ||||
| Privately Sponsored Refugee | 45 | — | 155 | 60 | 635 | 4,330 | 450 | 250 | 2,900 | 675 | — | 10 | 0 | 0 | 9,510 | ||
| Resettled Refugee | 505 | 70 | 560 | 355 | 1,610 | 8,230 | 855 | 940 | 5,060 | 1,800 | — | 10 | 0 | 0 | 19,995 | ||
| Protected Person in Canada | 15 | 15 | 65 | 40 | 5,685 | 27,375 | 385 | 85 | 2,910 | 3,215 | — | — | 0 | 0 | 39,790 | ||
| Resettled Refugee & Protected Person in Canada – Total | 520 | 85 | 625 | 395 | 7,295 | 35,605 | 1,235 | 1,025 | 7,970 | 5,020 | 5 | 15 | 0 | 0 | 59,795 | ||
| All Other Immigration – Total | 40 | 10 | 70 | 15 | 2,240 | 7,185 | 180 | 40 | 765 | 665 | 5 | 0 | 40 | 410 | 11,665 | ||
| Total | 2,060 | 2,630 | 9,025 | 5,320 | 50,255 | 198,335 | 16,570 | 10,950 | 40,010 | 69,300 | 595 | 295 | 40 | 410 | 405,795 | ||
| Percentage | 0.51% | 0.65% | 2.22% | 1.31% | 12.38% | 48.88% | 4.08% | 2.70% | 9.86% | 17.08% | 0.15% | 0.07% | 0.01% | 0.10% | 100.00% | ||
*Data source: IRCC open data at Open Government.

Our main hub for British Columbia is located in the heart of Vancouver. We also have a Kamloops Office for interior residents. That said, we serve the entire province of BC. We have the infrastructure to work with any of our clients virtually — even the furthest regions of British Columbia.
Call (604) 423-2646 [toll free 1-877-402-1002] to get routed to the best representative to serve you or contact us online for general inquiries.
We also have a dedicated intake form to help you get the ball rolling. Our intake team will review your specific case and advise you on the next steps to take as well as what to expect moving forward.
Our offices are generally open 8:30 a.m.—4:30 p.m., Mon—Fri.

The Legal Review Process by Taylor Janis Workplace Law
- Taylor Janis strives for high-quality, legally verified content.
- Content is meticulously researched and reviewed by our legal writers/proofers.
- Details are sourced from trusted legal sources like the Employment Standards Code.
- Each article is edited for accuracy, clarity, and relevance.
- If you find any incorrect information or discrepancies in legal facts, we kindly ask that you contact us with a correction to ensure accuracy.


